Implement Chart.js In Your React Application Today
For those unfamiliar with this package, Chart.js is an excellent data visualization tool that is easily accessible to nascent React developers. I first encountered the library while building a cryptocurrency trading simulator. In my application, I utilized Chart.js in order to provide aspiring traders with graphs of historical price data. In this post, I detail a step-by-step guide for integrating Chart.js in a React application, and also supply a few simple code examples to showcase some basic Chart.js graphics.
INSTALLATION
The initial set up for Chart.js is quick and relatively painless. First, navigate to your project’s directory and enter the following line in your terminal.
npm install react-chartjs-2 chart.js --save
In this example, I am installing the React wrapper for Chart.js 2. After the package has finished installing, navigate to the React component that will contain the desired chart. Next, add the following import statement at the top of your file.
import {<ComponentName>} from 'react-chartjs-2';
Instead of the <ComponentName> placeholder in the above example, you will specify the types of charts that you want to import from the Chart.js package. Some of the available graphics are line, pie, bar, doughnut, and radar.
In terms of quick set-up, we have finished the simple installation, and we are ready to create a few clean charts.
LINE CHART
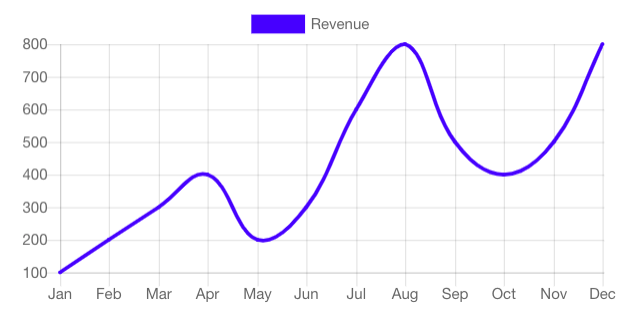
As as first example, I will walk through the process of creating a simple line chart. This component is ideal for time series data, and I utilized it throughout my cryptocurrency application. In my file, I initially imported the Line component from the Chart.js library. Next, I constructed a data object with the appropriate attribute names and bare-bones data set. Finally, I rendered the Line Chart by inserting the Line component and passing my data object into the component’s data props.
Full Code
Generated Chart

RADAR CHART
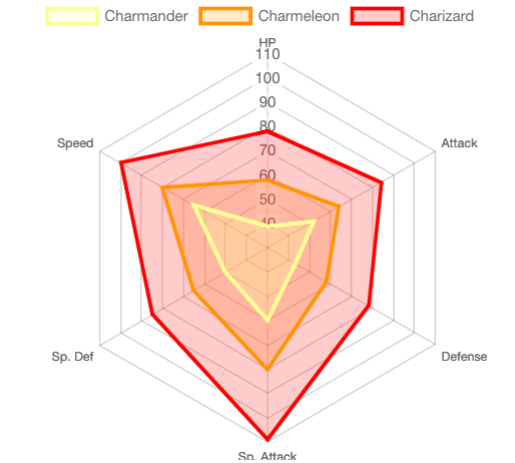
The Radar component is another Chart.js element that can enhance data visualization. In a similar process to the above example, I import the Radar component from the Chart.js library and construct the relevant data set.
Full Code
Generated Chart

For my own application, I ultimately refactored and offloaded the process of constructing these data objects to a separate chart building file.
In this post, I have demonstrated two uncomplicated examples of Chart.js implementation. I highly recommend perusing the official documentation in order to delve further into the nuances of the library.